Spring 2020 Update
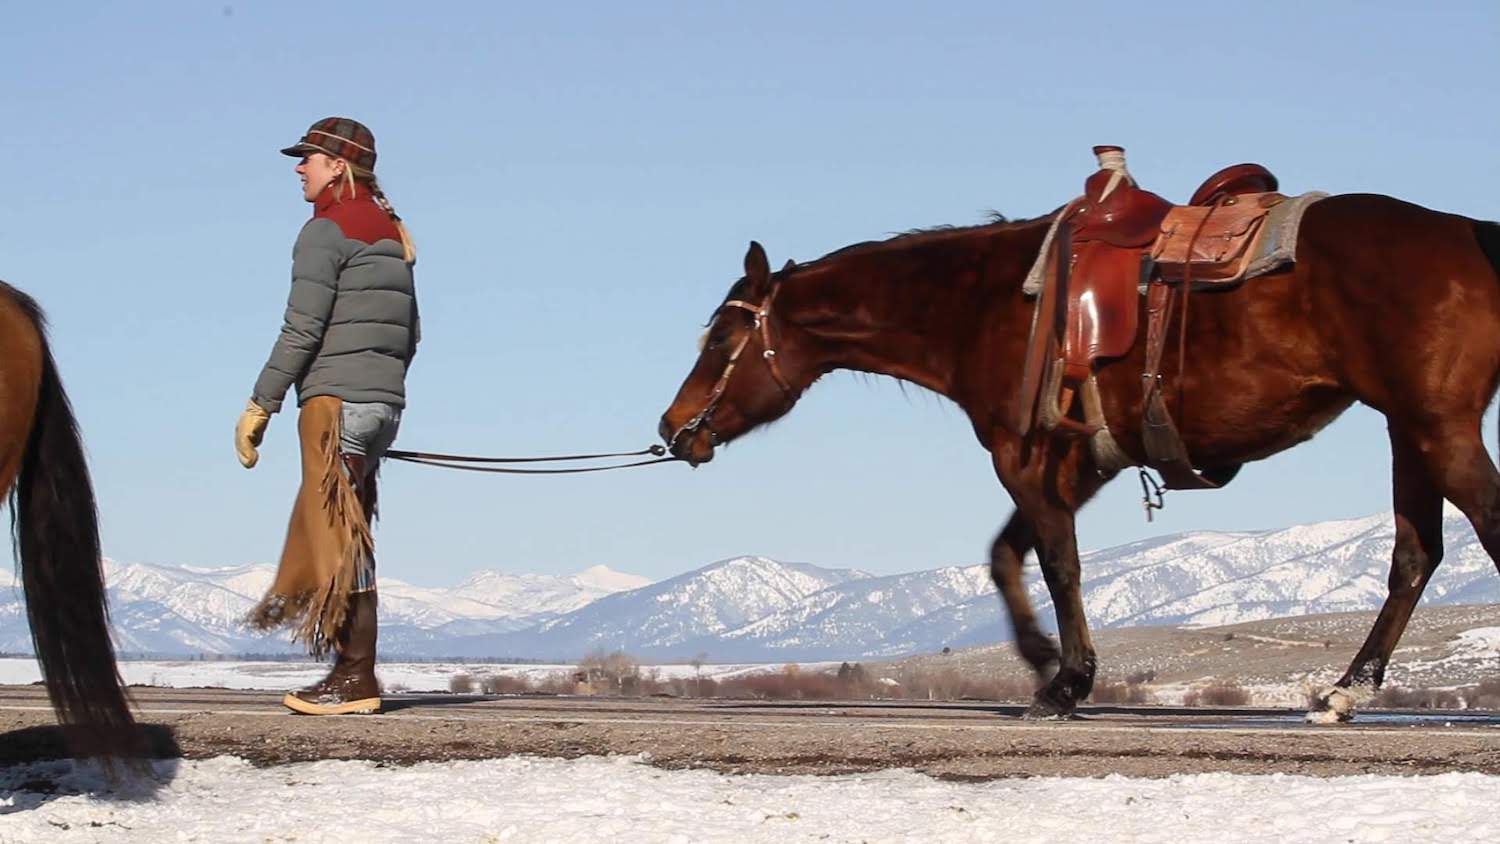
Moving cattle on a snowy spring morning in the Blackfoot Valley. Photo: Ada Smith.
 Temperature
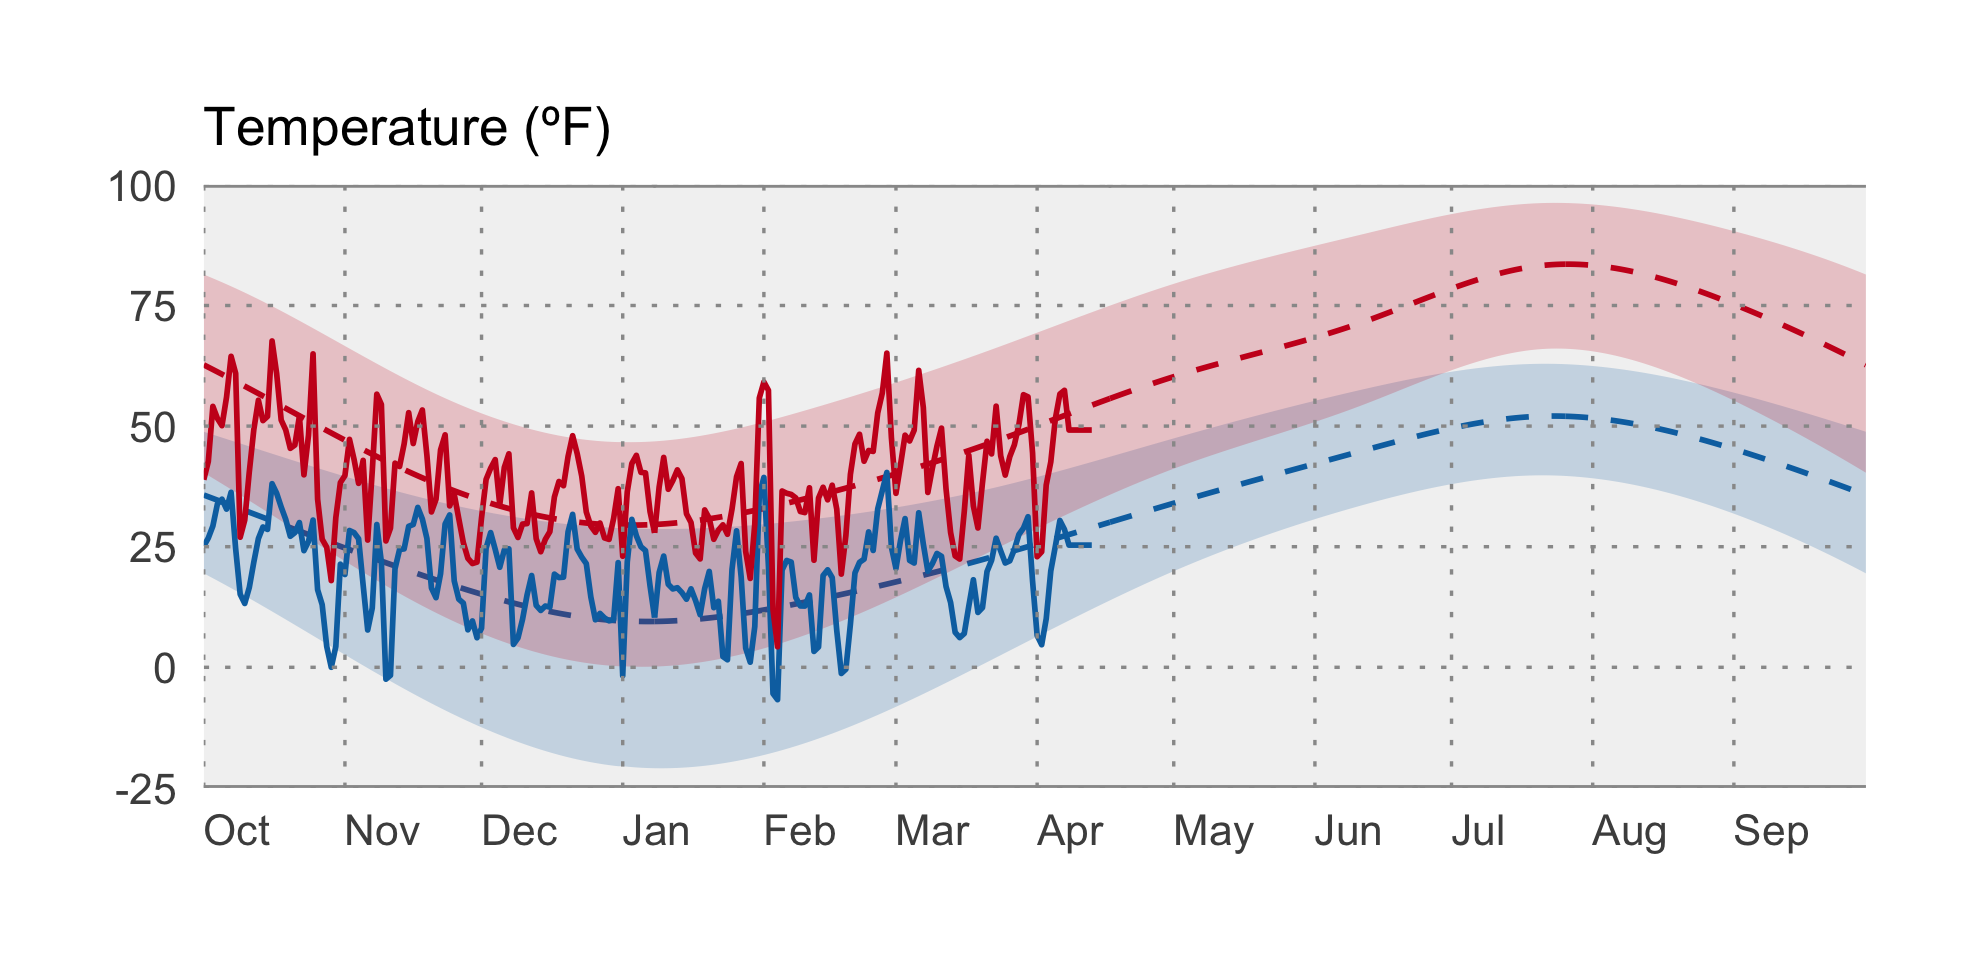
Last month’s temperature predictions from NOAA’s Climate Prediction Center (CPC) hit the mark — since March 1st, temperatures across the state have been below normal, especially in northern Montana, parts of which have experienced temperatures nearly 5ºF colder than normal. This has really helped Montana retain its snowpack, despite drier than average conditions.
The graph below compares historical daily temperatures (shaded bands and dashed lines) to current daily temperatures so far in 2020 (solid-jagged lines) across Montana. The shaded bands represent the range of recorded temperatures during the 1981–2010 period on any given day. The red bands and lines represent the high temperatures and the blues bands and lines represent the lows. The dashed red and blue lines represent the average high and average low temperatures during the 1981–2010 period.
 Precipitation
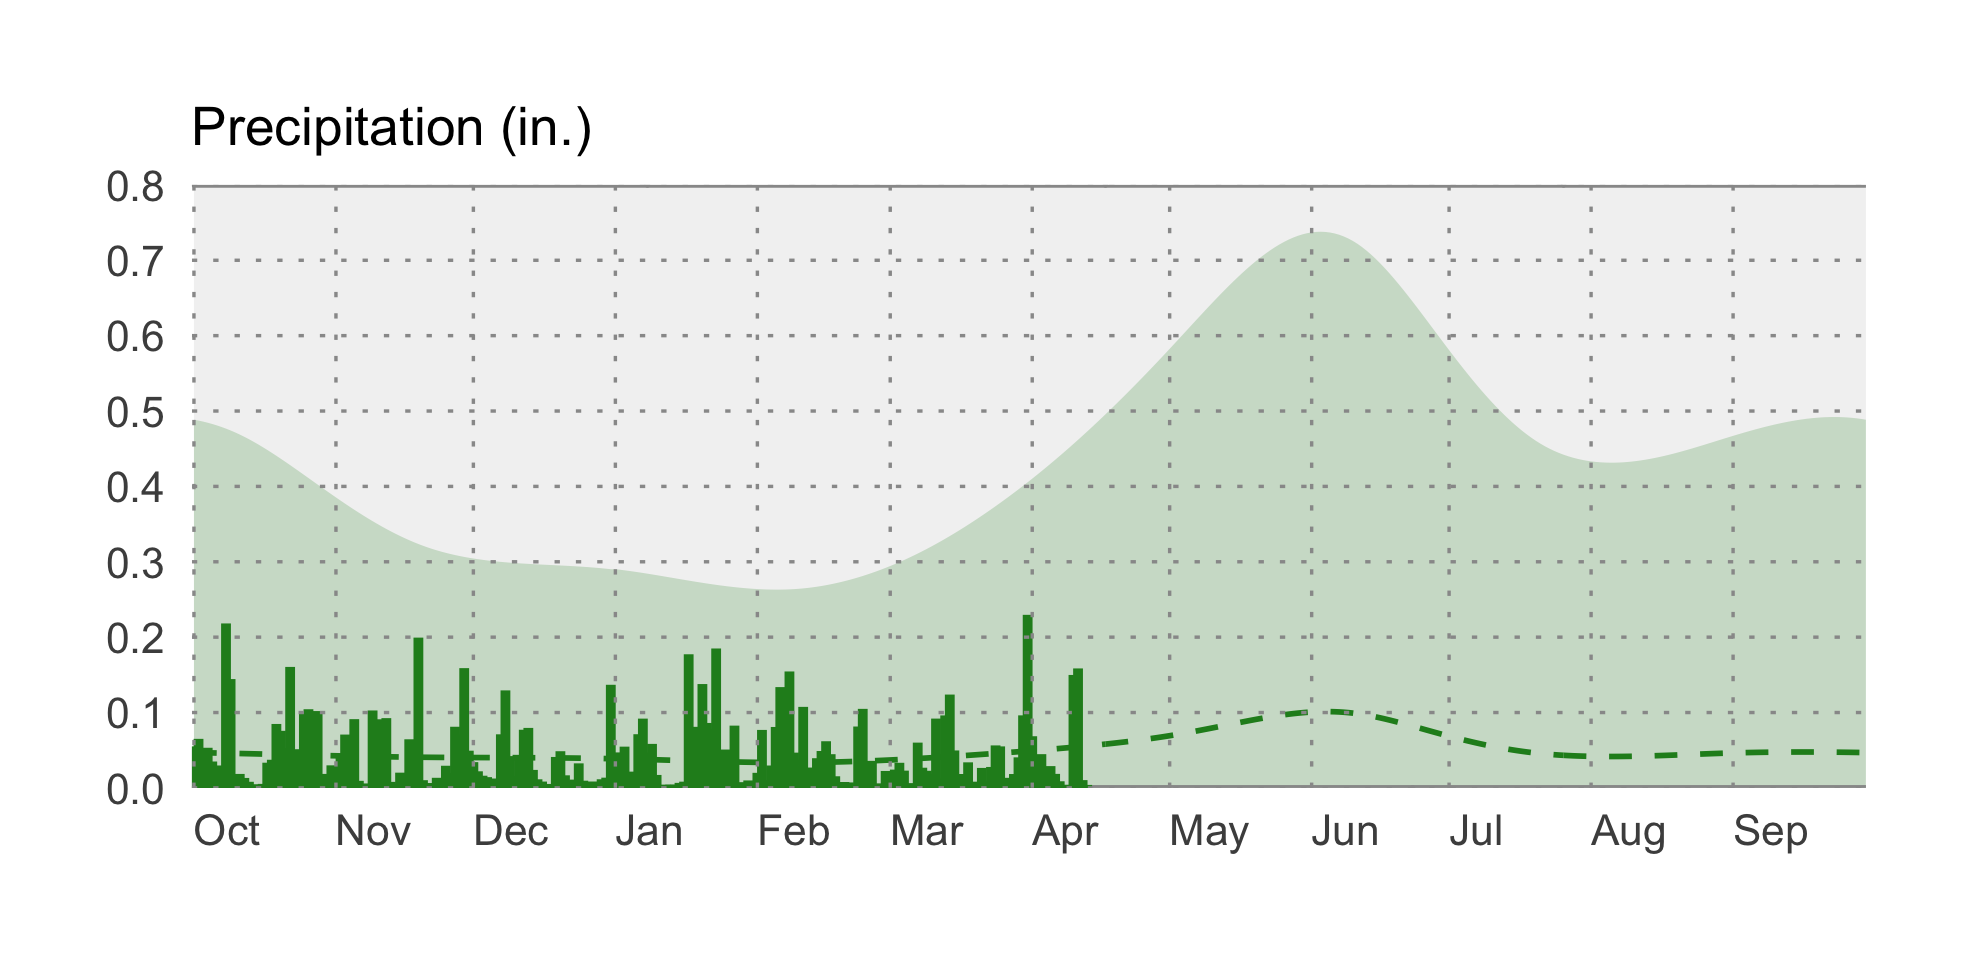
Conditions since March have been very dry for most of Montana, with the exception of the central part of the state. Areas of western Montana have received only 35% of their normal March–April preciptation, and parts of southeast Montana only 20%. Meanwhile, several wet storms have brought greater than normal precipitation to parts of central Montana, with areas west of Billings experiencing nearly 175% of their normal March–April preciptation, and areas west of Great Falls nearly 165%. These precipitation events in combination with snowmelt resulted in small-stream flooding in Blaine and Hill counties, and flood warnings for the Milk River in early April. This aligns with flood risk being above normal for much of the Missouri River Basin heading into summer.
The graph below compares historical daily precipitation (shaded band and dashed line) to current daily precipitation so far in 2020 (vertical bars) across Montana. The shaded band represent the range of recorded precipitation during the 1981–2010 period on any given day. The dashed line represents the average precipitation during the 1981–2010 period.
 Snowpack
Due to cooler than normal conditions and a series of spring storms, as of mid-April snowpack is normal to above normal across Montana. Snow Water Equivalent (SWE) values range from 95% of normal in Jefferson basin east of Butte to nearly 132% of normal in the North Fork Flathead basin north of Whitefish. As we move into this Spring, it will continue to be important to pay attention to temperatures, which will have a large impact on snowmelt rates.
 Drought
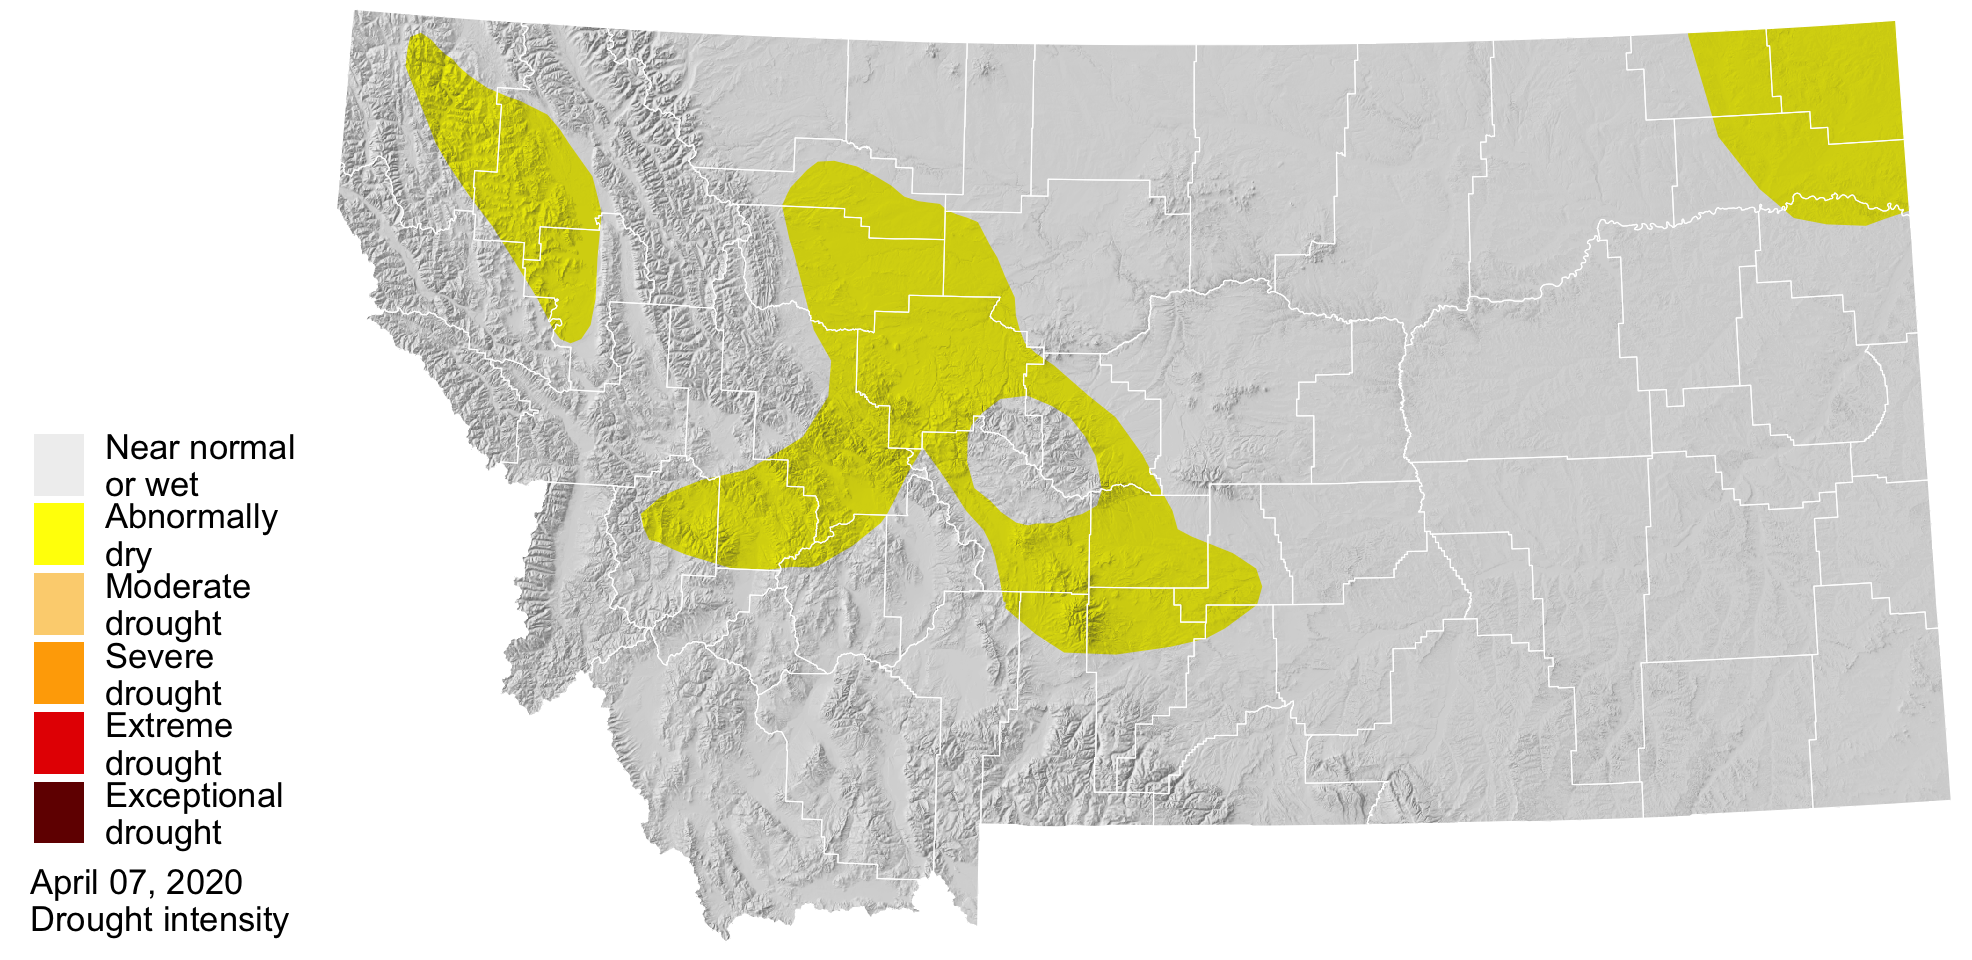
Despite higher than normal snowpack across most of the state, the US Drought Monitor has categorized several areas of Montana as abnormally dry going into mid-April, including northwest Montana around Kalispell, an area north of Livingston and Big Timber, the northeast corner of the state, and the Interstate 15 corridor from Helena to Shelby. This has been driven primarily by persistent below-normal precipitation. The location of spring storms will continue to determine whether drought conditions are declared going into the summer.