Spring Forecast
A row of grain bins catch the last light of the day near Inverness, Montana. Photo: Todd Klassy Photography.
 El Niño Update
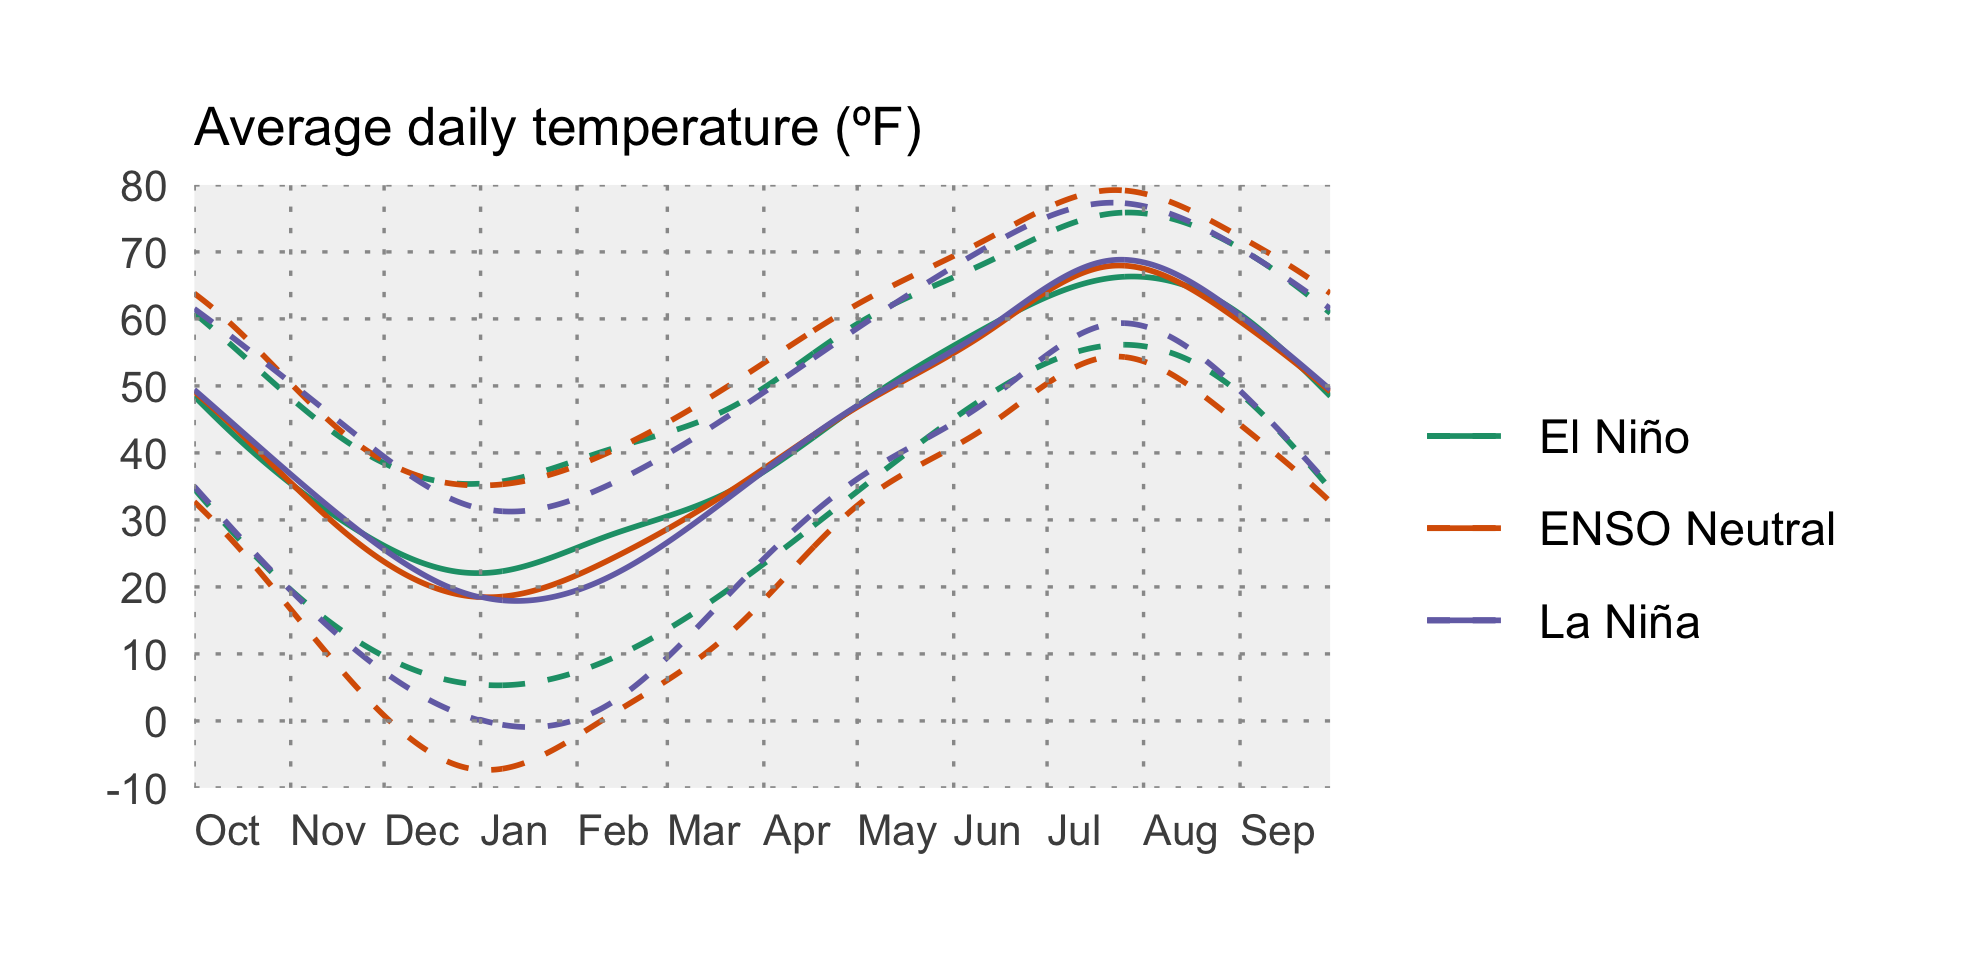
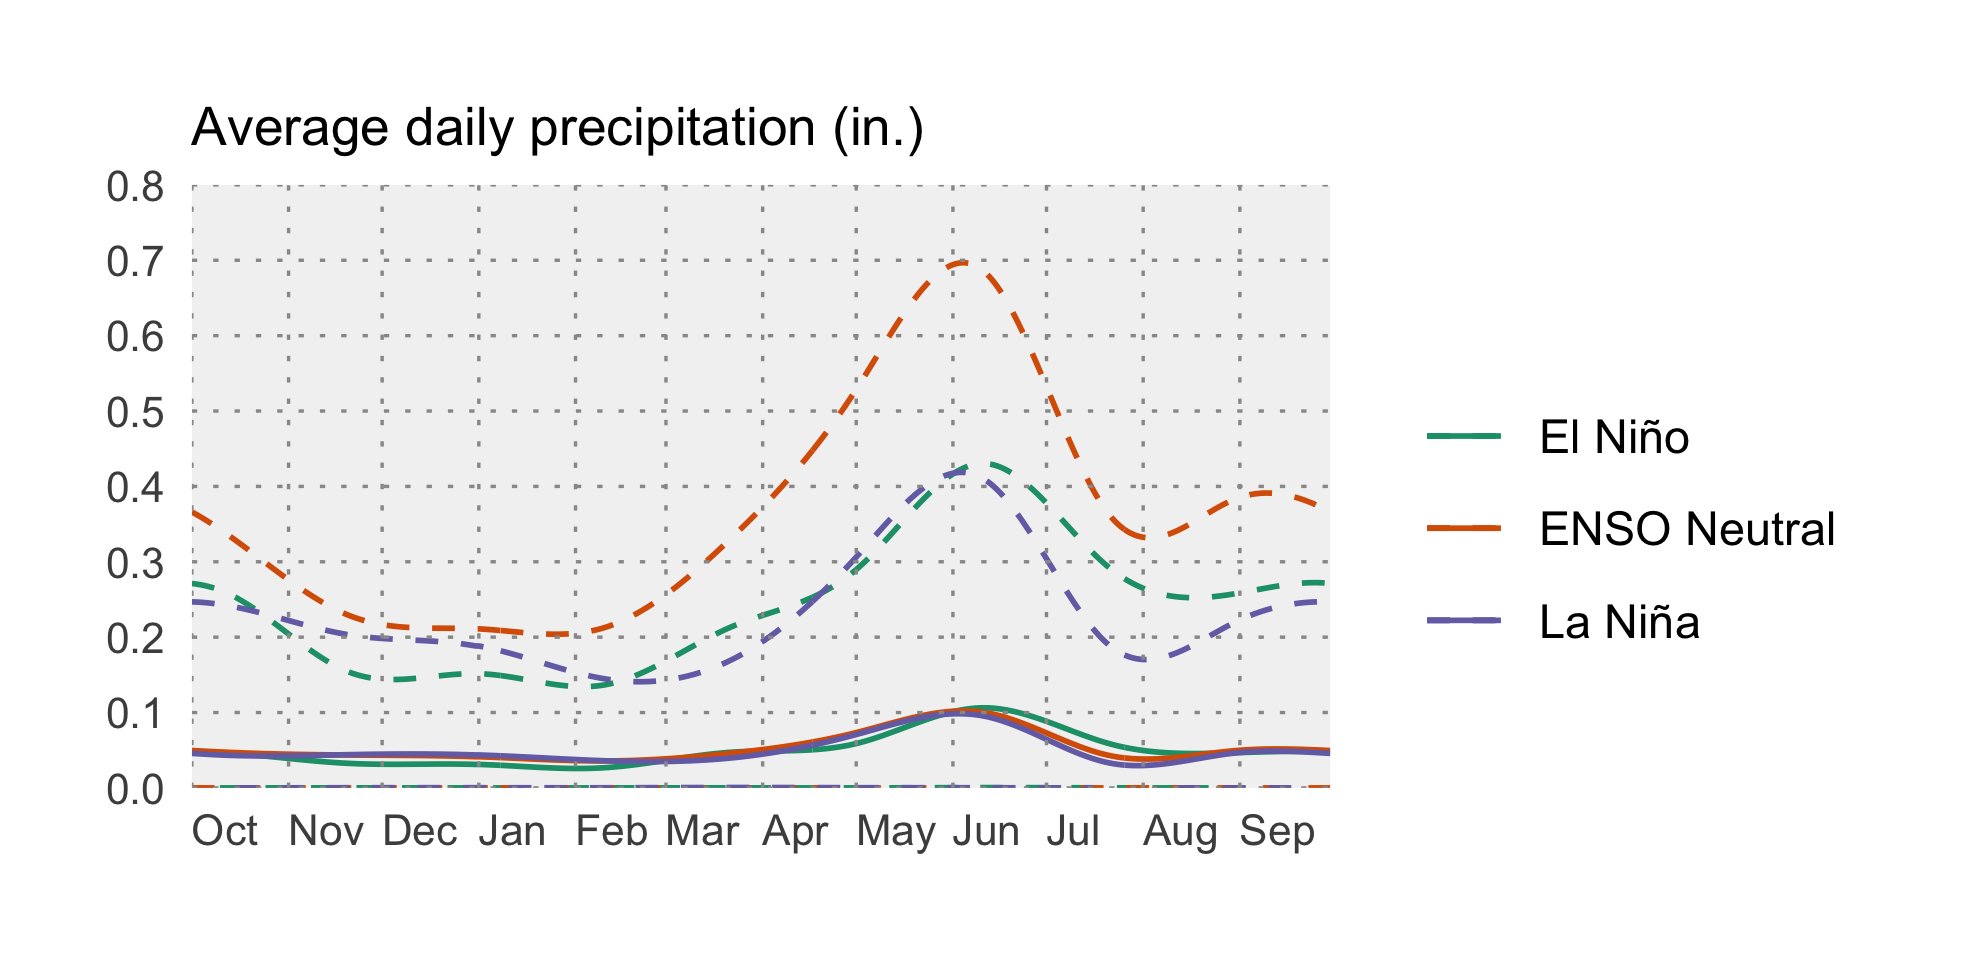
The El Niño Southern Oscillation (ENSO) is a natural seasonal fluctuation in the sea surface temperature of the Pacific Ocean near the equator. In July, the Pacific officially moved out of El Niño conditions, and is currently in ENSO Neutral conditions (neither El Niño nor La Niña). NOAA is forecasting that it will likely stay neutral through this coming spring. In Montana, winter and spring conditions vary greatly under ENSO Neutral. The two graphs below show how Montana as a whole is affected by the ENSO climate patterns. The solid lines represent the average conditions in each of El Niño, La Niña, and ENSO Neutral conditions (see the Reference section for an explanation of these conditions). The dashed lines represent the range of recorded conditions during the 1981–2010 period on any given day. Notice that the range for ENSO Neutral conditions (orange dashed lines) is wider than for El Niño or La Niña—ENSO Neutral conditions can be warmer or cooler, and wetter or dryer, than normal conditions.
 Temperature
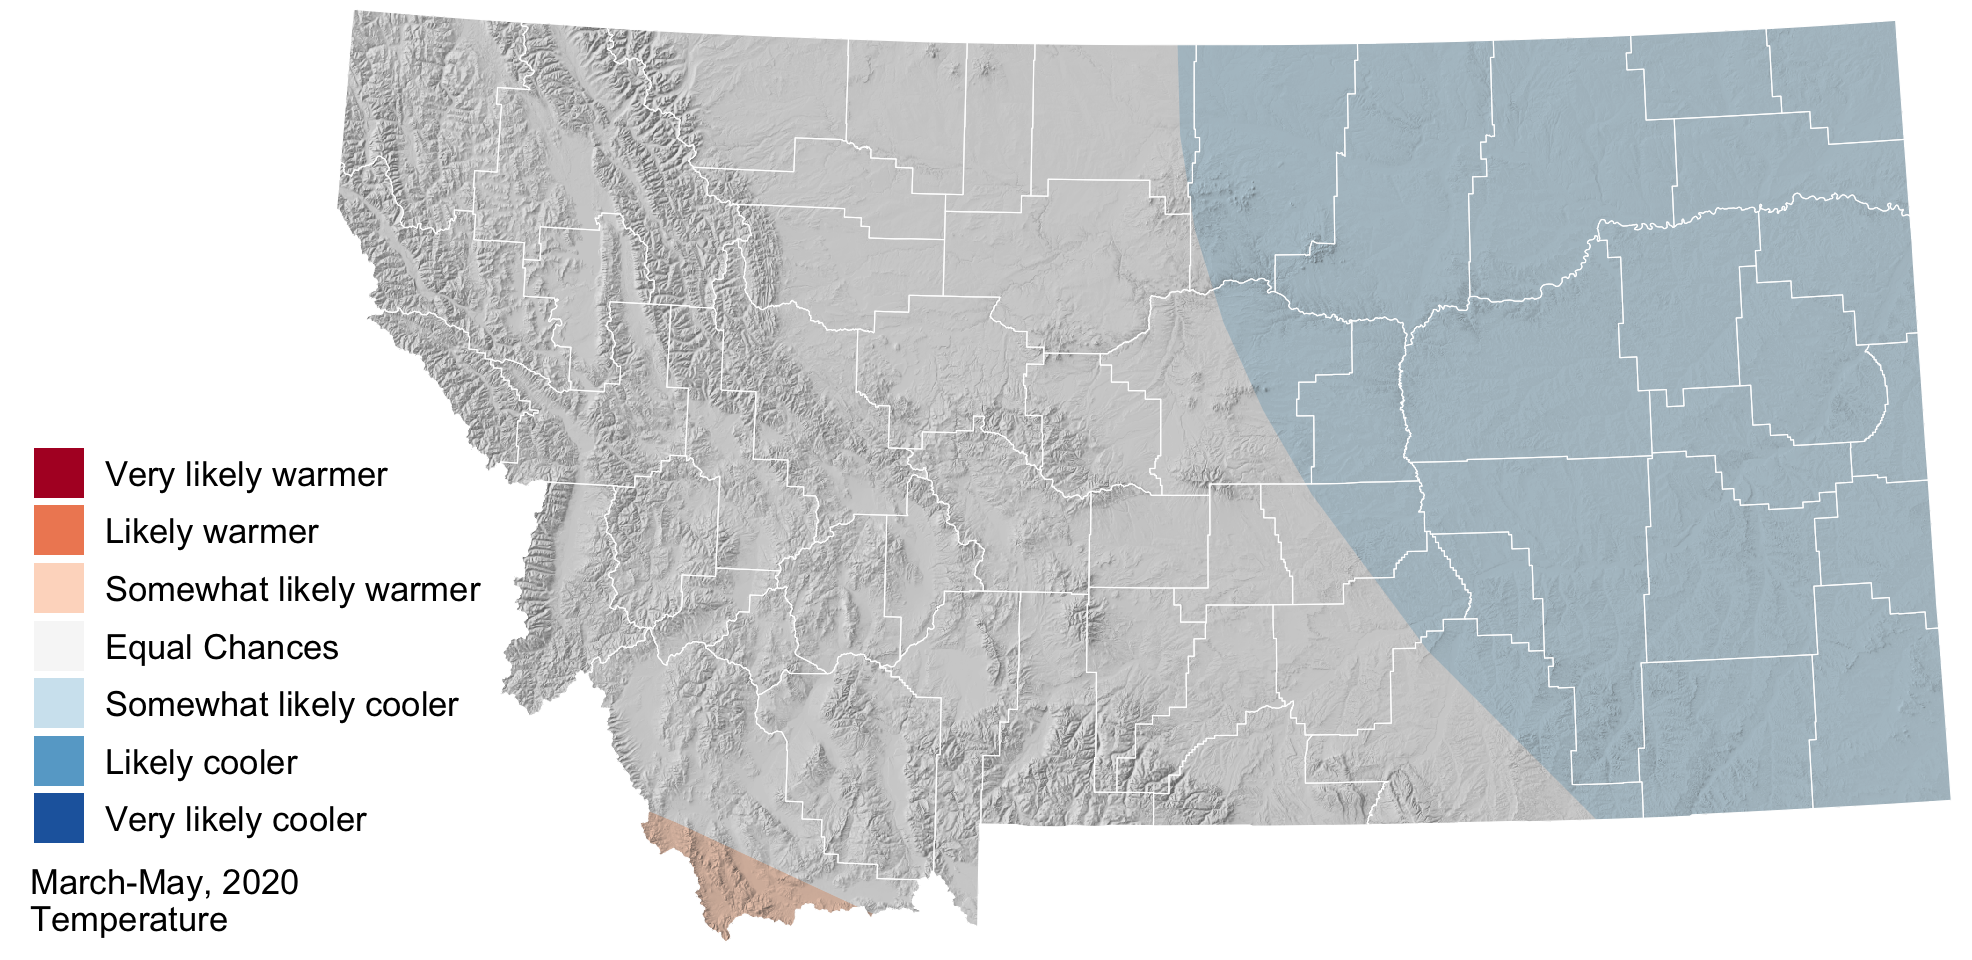
During ENSO Neutral conditions, climate forecasters rely on other types of data to create seasonal outlooks (since neither El Niño nor La Niña is influencing the state). NOAA’s Climate Prediction Center (CPC) is projecting that temperatures are somewhat likely to be cooler than normal across eastern Montana into early spring (March–May). This is a fairly weak prediction (due to ENSO Neutral conditions); there is still a chance that temperatures could be warmer than normal. Most of the rest of the state has equal chances of being cooler or warmer than normal.
 Precipitation
NOAA’s Climate Prediction Center (CPC) is forecasting that March–May precipitation across eastern Montana is likely to be wetter than normal, with the rest of the state having equal chances of being wetter or drier than normal. Keep in mind that while the CPC is projecting wetter conditions in eastern Montana, this map doesn’t reflect how much wetter is it likely to be, or the intensity of specific precipitation events.
