Reference
Weather and climate forecasters use words and information in very particular ways that may be different from what we are accustomed to. Here is a list of terms we use in this newsletter:
![]()
Weather and Climate — The difference between weather and climate is timescale. Weather is the day-to-day interaction of factors like temperature, humidity, precipitation, cloudiness, visibility, and wind. To understand climate at a given place requires looking at weather trends over relatively long periods of time—months, years, and decades. In addition to studying weather, scientists examine climate trends or cycles of variability to understand the bigger picture of long-term changes.
![]()
Temperature and Precipitation — Throughout this newsletter, we report past temperature and precipitation data derived directly from the GridMET daily 4-km-gridded meteorological dataset from the University of Idaho. Temperature data are reported as seasonal averages; precipitation data are reported as seasonal total precipitation. Our three-month temperature and precipitation forecasts come from NOAA’s Climate Prediction Center.
![]()
Normal(s) — Climatologists use the term “normal” to compare current conditions or forecasts, such as temperature or precipitation, to the past. Here, the normal value is the statistical mean (the average) for a given measurement in a specific place during a specific period of time. Climatologists use the most recent 30-year period, rounded to the nearest decade, to define normal in North America: 1981–2010. The goal is to look far enough back in time to capture variation in weather patterns, but not so far as to be irrelevant to recent conditions. In 2021, we will start using the 1991–2020 period.
![]()
Drought — The US Drought Monitor identifies general areas of drought and labels them by intensity. Maps of drought intensity are used by policy-makers, resource managers, and agricultural producers to make decisions. More information about the US Drought Monitor can be found at the US Drought Monitor website.
![]()
La Niña/El Niño — El Niño and La Niña are the warm and cool phases of a recurring climate pattern across the tropical Pacific, the El Niño Southern Oscillation (ENSO). When ENSO is between warm and cool phases, conditions are called ENSO Neutral. ENSO is one of several global climate phenomena that affect Montana’s weather patterns, and ENSO conditions often guide seasonal climate projections for Montana. Current ENSO conditions and up-to-date projections are available on NOAA’s ENSO website.
![]()
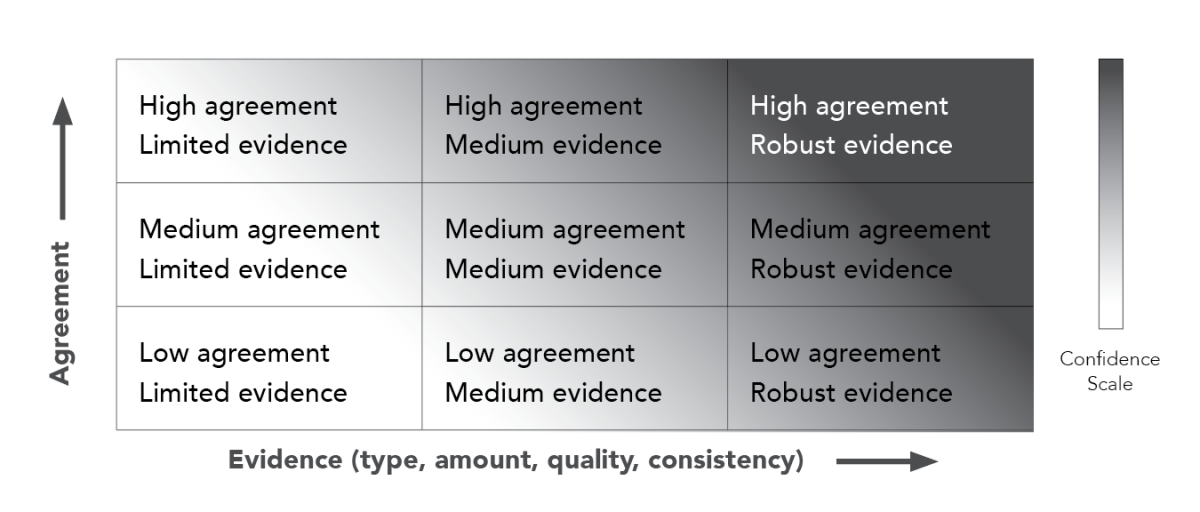
Mid-century Projections — We present summaries of mid-century (AD 2040–2069) climate change impacts from the Montana Climate Assessment (MCA). The MCA findings are derived from careful analysis of many global climate projections that were run as part of the Coupled Model Intercomparison Project Phase 5 (CMIP5), and how those projections will likely affect people in Montana. Climate change projections and impacts are uncertain. Each key message provided here is followed by an expression of confidence that assesses a) the level of agreement among experts with relevant knowledge used to craft the message, and b) the quality of the evidence supporting the message.
![]()
Root Zone Soil Wetness — Root Zone Soil Wetness is a measure of how much water has saturated the soil. More specifically, it’s the relative saturation between completely dry (indicated by a 0) and completely saturated (indicated by a 1) between 0 and 100 cm depth. In the maps in this newsletter, soil saturation comes from NASA’s Soil Moisture Active Passive (SMAP) satellite program “SPL4SMGP” data product. Soil moisture is mapped using a combination of radar and radiometer measurements from space and surface observations at an approximately 9-km spatial resolution.